


I had blood drawn recently. I am seventy-one, I eat almost no carbohydrate, and most of what I do eat is meat, eggs, butter, cream and cheese. Here is what came back.
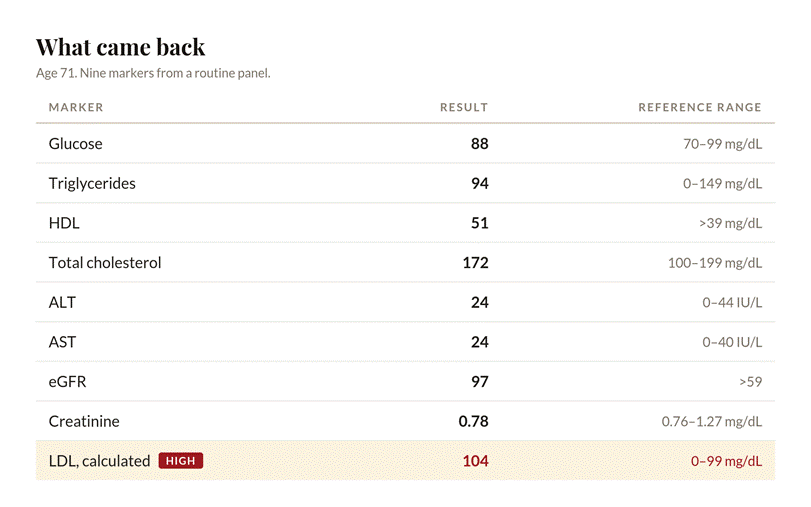
Every red and white cell index sits mid-range. Liver enzymes are unremarkable. Kidney filtration at seventy-one is better than a good many people have at fifty. The portal itself summarised the metabolic panel in one line: kidney function, liver function and electrolytes look good.
Then it generated the only piece of advice in the entire report.
Your LDL cholesterol was mildly elevated. Focus on diet and exercise but no need for any medications. Avoiding red meat and fried foods can help to lower this number.
Start with what that sentence puts in one basket
Red meat and fried foods. One category, one instruction.
In the American food supply, fried food means industrial seed oil heated repeatedly — the most chemically abused fat most people encounter. Steak is not that. The two things share nothing except an old and now slightly embarrassed association with the word fat, and the framework issuing the advice cannot separate them because it was never built to.
That is not a machine error. It is a fifty-year-old category, still executing.
Now the number itself
The flagged value is 104 against a cutoff of 99. Five points. And it is not measured — nobody put my blood in an instrument and read LDL off a dial. It is derived, and the report says so in its own label: LDL Cholesterol Calculated.
The calculation is total cholesterol, minus HDL, minus VLDL. On my panel: 172 minus 51 minus 17 equals 104.
VLDL, in turn, is estimated from triglycerides. Low triglycerides give a low VLDL. And a low VLDL, subtracted from a fixed total, leaves a larger remainder.
So hold my total cholesterol exactly where it is and give me worse triglycerides. Take them from 94 to 149 — still inside the reference range, still officially normal, but metabolically a considerably worse place to be. VLDL rises. The subtraction changes. Calculated LDL falls to somewhere in the low nineties.
Under the cutoff. Flag clears. No comment generated. No advice about red meat.
I could have passed this screen by being metabolically worse. Not by a trick, not by gaming anything — just by having the triglycerides of an ordinary sixty-year-old instead of the ones I have. The equation would have done the rest.
The exact figure depends on which estimating equation the lab uses, and the newer ones are less crude than dividing triglycerides by five. The direction is not in dispute. Better triglycerides raise your calculated LDL. That is what the formula does.
The second flag is the same kind of animal
One other line came back marked high: my BUN-to-creatinine ratio, at 28 against a range topping out at 24.
BUN was 22, inside range. Creatinine was 0.78, inside range. Neither number is abnormal. The ratio is flagged because a high-normal numerator sits over a low-normal denominator, and eating a lot of protein raises BUN. Meanwhile the actual measure of kidney filtration, eGFR, came back at 97.
Two in-range values, divided, produce an out-of-range result. Nothing was found. Something was computed.
The number nobody calculated
There is a ratio on this panel that does track metabolic health closely, and the report does not contain it, because it is not a field.
Triglycerides divided by HDL. Mine is 94 over 51, which is 1.84. Under two is where you want to be; above three is where insulin resistance and small dense LDL particles start showing up. Total cholesterol over HDL is 3.37, which is also fine.
Both numbers are sitting right there in the results. Neither was computed, neither was flagged, and neither generated a comment — because a screening system reports on rows, and those ratios are not rows. What gets measured gets flagged. What gets flagged generates the advice. The rest of the panel might as well not exist.
Where the guidelines are not wrong
I want to be careful here, because there is a version of this essay that overreaches and I have read too many of them.
LDL 104 is mildly elevated by current guidelines, and the mainstream position on LDL is not arbitrary. The evidence linking it to atherosclerosis is substantial and comes from several independent directions, including genetics and drug trials. Anyone telling you cholesterol is a hoax is selling something.
What my panel supports is narrower and, I think, harder to argue with: the same LDL number means different things in different bodies. A 104 alongside triglycerides of 94, HDL of 51, glucose of 88 and normal liver enzymes is not the same finding as a 104 alongside triglycerides of 250, HDL of 32 and a fatty liver. One is a lipid value in a metabolically healthy person. The other is one symptom in a cluster.
The screening system cannot tell those apart. It sees one row, over by five.
If I wanted to settle the question rather than argue about it, the measure both camps are converging on is ApoB, which counts particles instead of inferring cholesterol mass. That is where the actual scientific disagreement now lives, and it is not on this panel either.
What this is really about
I am not upset about the comment. It is automated, it is cautious, and it explicitly told me I do not need medication, which is more restraint than the same finding would have received twenty years ago.
What interests me is the shape of it. A panel comes back showing a seventy-one-year-old with normal glucose, low triglycerides, unremarkable liver enzymes and better-than-typical kidney function. The system finds one derived number five points over an arbitrary line and produces a single instruction: eat less of the food that produced the panel.
It could not do otherwise. It has one flaggable field and a decades-old rule attached to it. It cannot see the ratio that matters because the ratio is not a row, and it cannot distinguish a steak from a deep fryer because the category it inherited never did.
The advice was not wrong for me specifically. It was generated without reference to me at all.